Nervecentre V9.0 Help for Users
Viewing charts
You can view changes in a patient's data over time. You can view changes in observations, medications, results from investigations, fluid balance, case notes, and tasks.
Charts bring together these different elements of patient care into a single view, so that you can understand the effect of your interventions. For example, you can view how your care has affected a patient's temperature, blood pressure, and other recorded observations over the past few days.
Some types of data are only visible when the patient is admitted. For example, fluid balance, and some observations.
Viewing charts on a mobile
You can't do this on a mobile.
Viewing charts on a desktop
 Overview of Charts
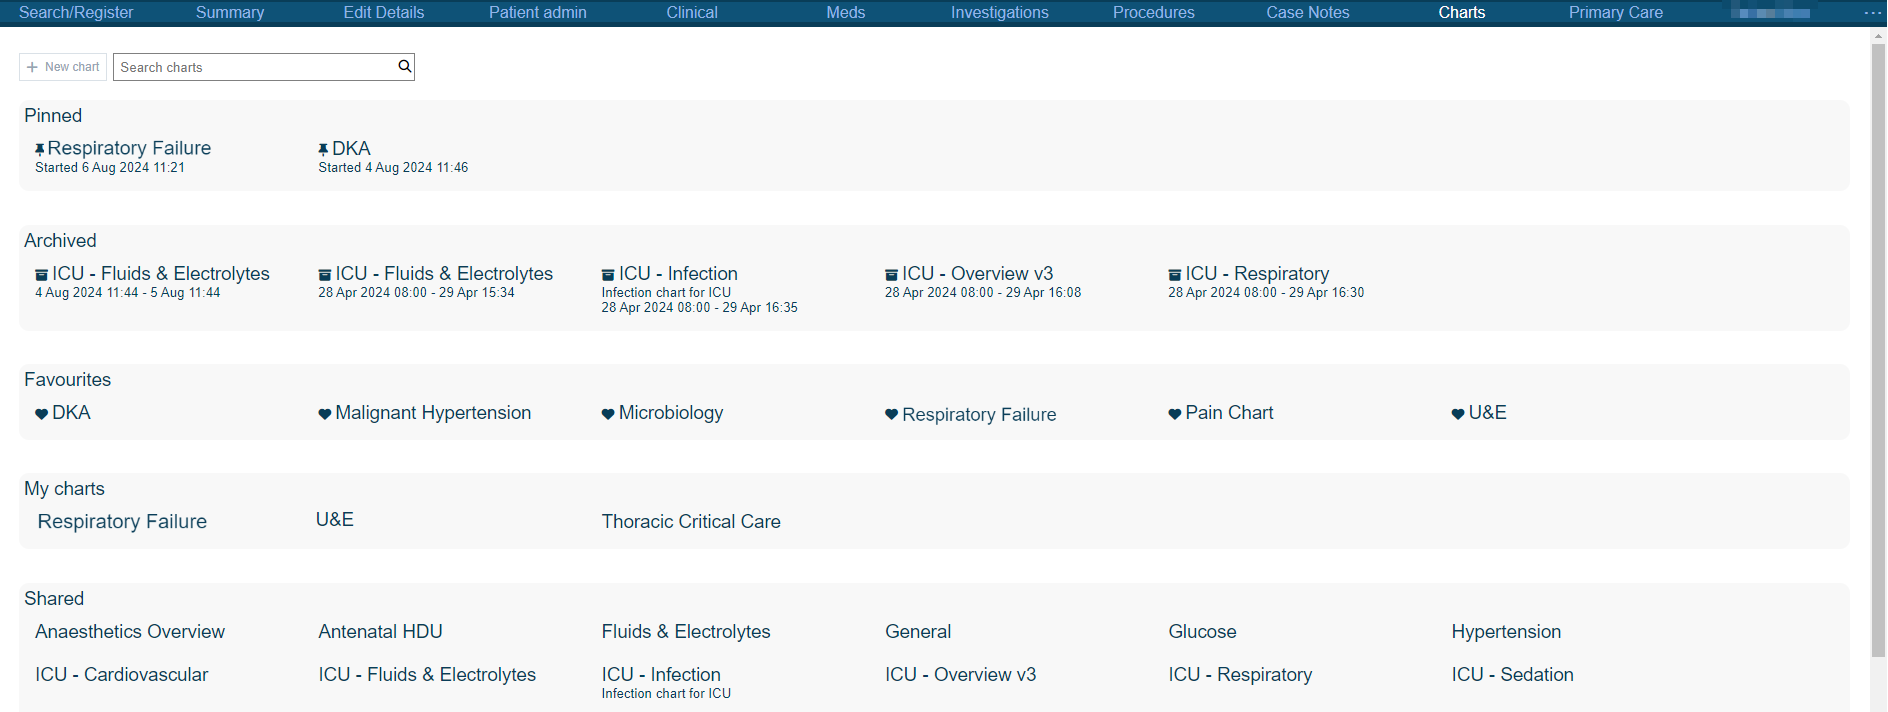
From Patient Detail > Charts, you can view a list of charts. To view a specific chart, select the chart.
Read more about viewing charts
|
+ New chart |
Select to create a new chart. Depending on your permissions, you can create and edit template charts. |
|
Search charts |
Type to search for a chart. |
|
Pinned |
Shows any pinned charts for the patient. |
|
Archived |
Shows any archived charts for the patient. |
|
Favourites |
Shows any template charts you have marked as your favourites. |
|
My charts |
Shows any template charts you have created. |
|
Shared |
Shows any template charts that are shared. |
Viewing a chart
-
Open the patient's record.
-
From Inpatients, select Patient List > double-click on a patient's name > Patient Detail.
-
From Outpatients, select Clinic List > double-click on a patient's name > Patient Detail.
-
-
Select Charts.
A list of charts appears.
If the patient has a pinned chart, the most recently pinned chart appears. To view the list of charts, select < More charts.
-
To search for a chart, select Search charts, then type in the name of a chart.
-
From the list, select a chart.
The chart displays one or more widgets in one or two columns. Each widget displays data from one or more series.
A red line on each widget marks the current time.
You can:
-
Show hidden series
-
Change how a series displays
-
View a specific date and time
-
View data over a specific time period
-
Overview of a template chart
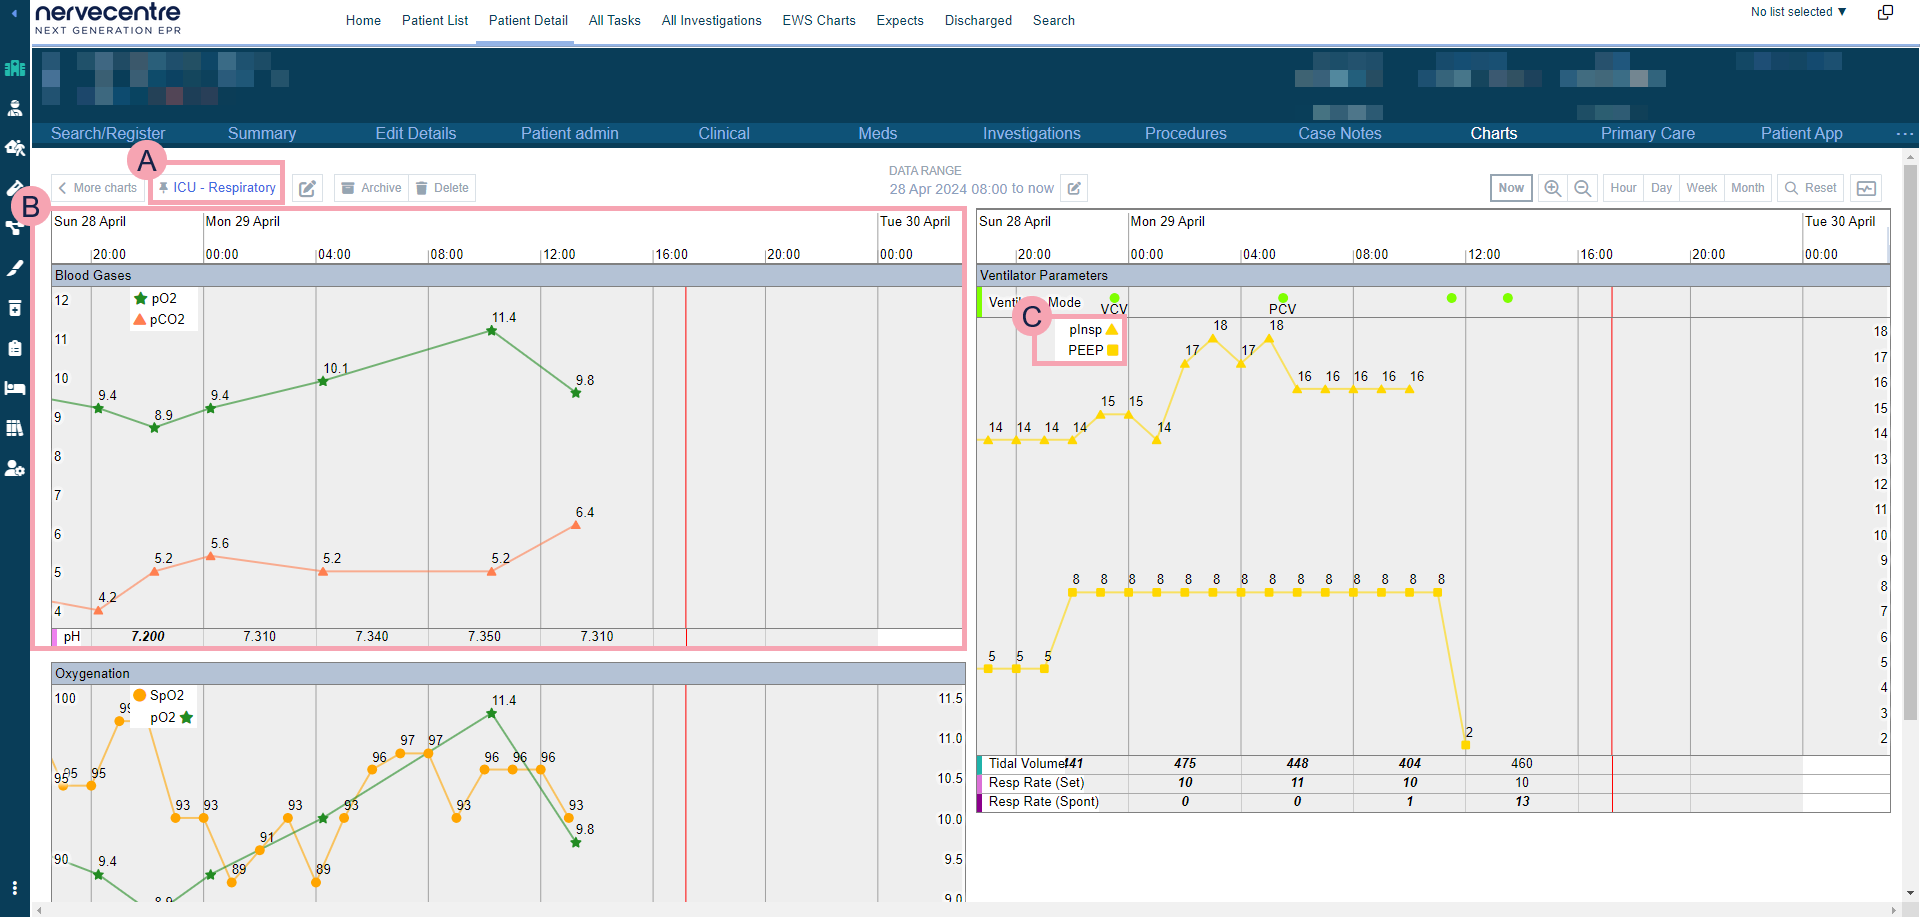
From Patient Detail > Charts, you can view template charts you own, template charts that have been shared, and template charts you have marked as a favourite.
Read more about template charts
Pinned charts and archived charts appear a little different to what you see below.
Read more about archived charts

|
< More charts |
Select to return to the list of charts. |
|
|
Name of the chart. Select to choose another chart to view. |
|
|
Select to favourite a chart. |
|
|
Select to pin a chart. |
|
|
Select to edit the chart. Depending on your permissions, you can edit a chart. |
|
|
Select to lock the view to the current time. When time advances, the chart automatically moves forward so the current time is always visible. If you select and drag to look at a different time, the chart unlocks. |
|
Now |
Select to view the current time. A red line on each widget marks the current time. |
|
|
Select to zoom in, or to view a shorter time period. For example, hours instead of days. |
|
|
Select to zoom out, or to view a longer time period. For example, weeks instead of days. |
|
Hour |
Select to view the data over an hour. |
|
Day |
Select to view the data over a day. |
|
Week |
Select to view the data over a week. |
|
Month |
Select to view the data over a month. |
|
Reset |
Select to reset the chart back to the default level of magnification. |
|
|
Select to manage MDI devices for the chart. |
|
|
A widget. The name of the widget appears in a grey bar at the top of the widget. Mouseover a widget to highlight a specific time period, and to view data over that time period. |
|
|
Select to choose which series to show in the widget. |
|
|
A legend for a line graph. This lists the series the line graph displays. Select the left side of the legend and drag to move the legend. Select the name of a series to change how the series displays. The display options you choose aren't saved. |


 Overview of a pinned chart
From Patient Detail > Charts, you can view pinned charts.
|
< More charts |
Select to return to the list of charts. |
|
|
Name of the chart. Select to choose another chart to view. |
|
|
Select to edit the chart. Depending on your permissions, you can edit a chart. |
|
Archive |
Select to archive the pinned chart. |
|
Delete |
Select to delete the pinned chart. |
|
DATA RANGE |
Shows the start date for the data on the chart. You can't view data outside this range. Select to choose the start date of the pinned chart. |
|
|
Select to lock the view to the current time. When time advances, the chart automatically moves forward so the current time is always visible. If you select and drag to look at a different time, the chart unlocks. |
|
Now |
Select to view the current time. A red line on each widget marks the current time. |
|
|
Select to zoom in, or to view a shorter time period. For example, hours instead of days. |
|
|
Select to zoom out, or to view a longer time period. For example, weeks instead of days. |
|
Hour |
Select to view the data over an hour. |
|
Day |
Select to view the data over a day. |
|
Week |
Select to view the data over a week. |
|
Month |
Select to view the data over a month. |
|
Reset |
Select to reset the chart back to the default level of magnification. |
|
|
Select to manage MDI devices for the chart. |
|
|
A widget. The name of the widget appears in a grey bar at the top of the widget. Mouseover a widget to highlight a specific time period, and to view data over that time period. |
|
|
Select to choose which series to show in the widget. |
|
|
A legend for a line graph. This lists the series the line graph displays. Select the left side of the legend and drag to move the legend. Select the name of a series to change how the series displays. The display options you choose are saved. |
Overview of an archived chart
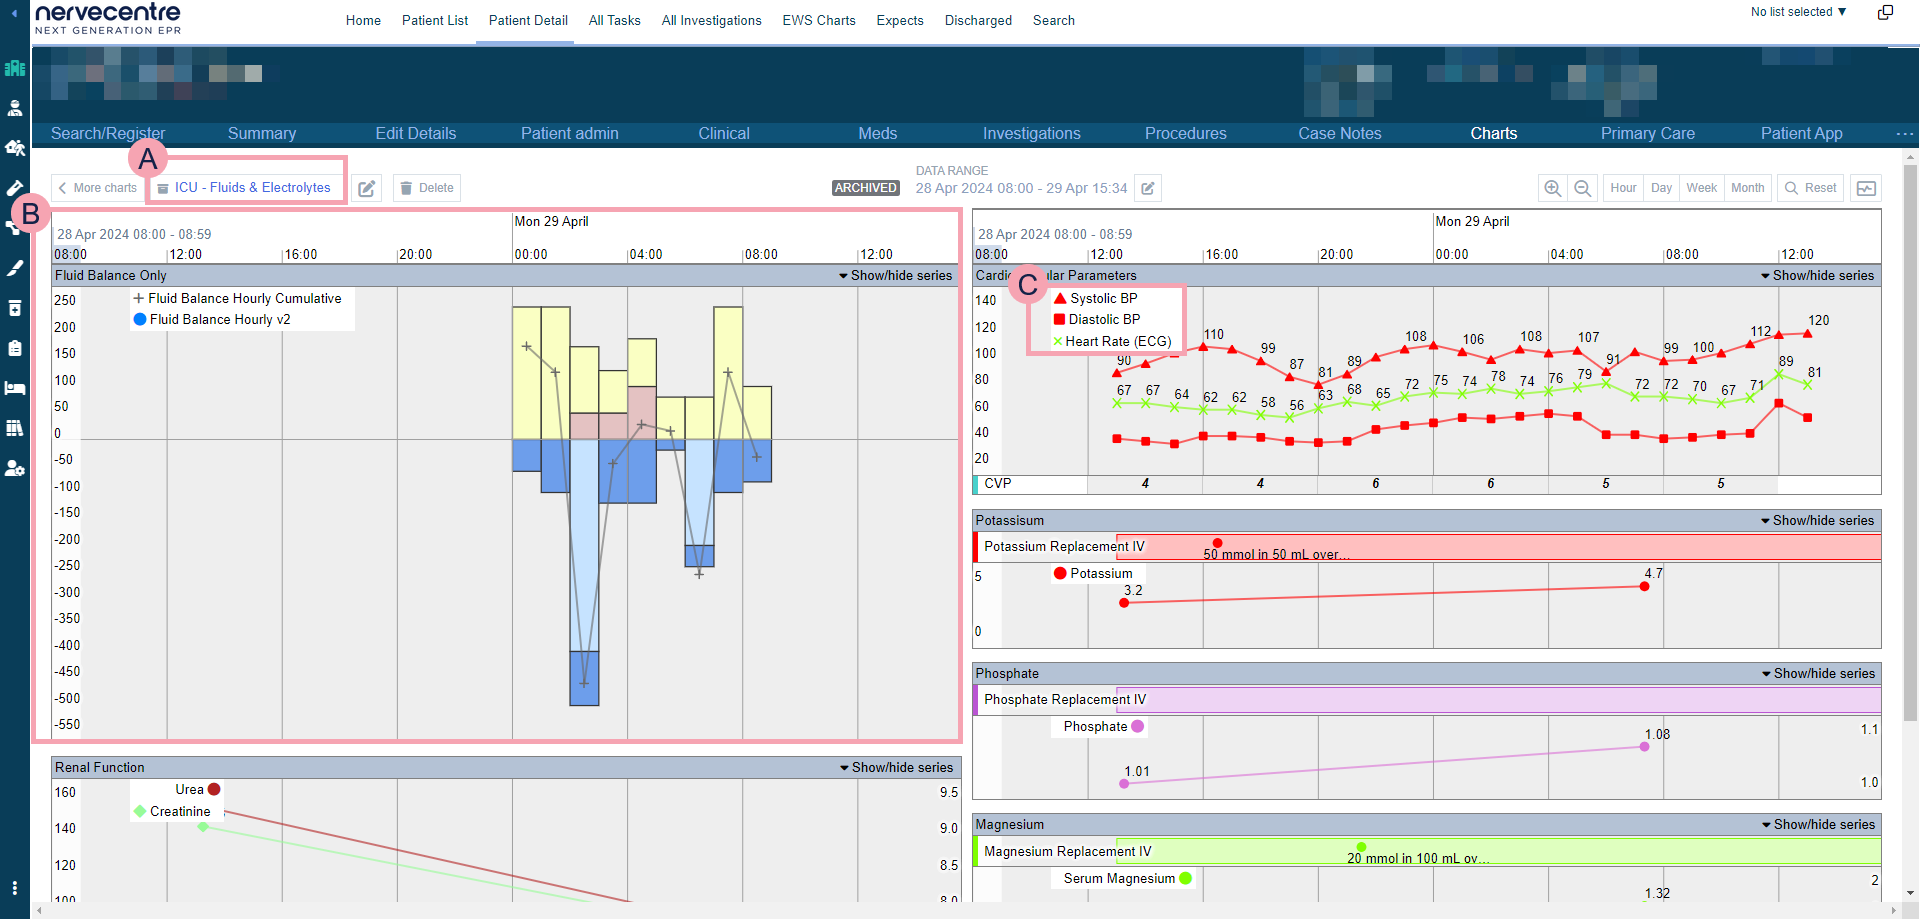
From Patient Detail > Charts, you can view archived charts.
Read more about archived charts
|
< More charts |
Select to return to the list of charts. |
|
|
Name of the chart. Select to choose another chart to view. |
|
|
Select to edit the chart. Depending on your permissions, you can edit a chart. |
|
Delete |
Select to delete the archived chart. |
|
DATA RANGE |
Shows the start date and end date for the data on the chart. You can't view data outside this range. Select to choose the start date and end date of the archived chart. |
|
|
Select to zoom in, or to view a shorter time period. For example, hours instead of days. |
|
|
Select to zoom out, or to view a longer time period. For example, weeks instead of days. |
|
Hour |
Select to view the data over an hour. |
|
Day |
Select to view the data over a day. |
|
Week |
Select to view the data over a week. |
|
Month |
Select to view the data over a month. |
|
Reset |
Select to reset the chart back to the default level of magnification. |
|
|
Select to manage MDI devices for the chart. |
|
|
A widget. The name of the widget appears in a grey bar at the top of the widget. Mouseover a widget to highlight a specific time period, and to view data over that time period. |
|
|
Select to choose which series to show in the widget. |
|
|
A legend for a line graph. This lists the series the line graph displays. Select the left side of the legend and drag to move the legend. Select the name of a series to change how the series displays. The display options you choose are saved. |
Showing and hiding series
-
From the grey bar at the top of a widget, select .
-
To show a series, select the name of the series.
-
To hide a series, clear the name of the series.
You can then choose how the series displays. For example, as a graph, or as a table.
Changing how a series displays
-
To change how each series displays, select the name of the series.
-
Select any of the options in the table below.
The options you choose are only saved for pinned charts and archived charts.
|
Display type |
Select an option to show or hide the series.
|
||||||||
|
|
If you select Graph, you can choose specific properties for the graph.
|
Viewing a specific date and time
-
To view data from a different date and time, from the top of a column, where the date and the time markers are shown, select and drag left or right.
-
To return to the current time, select Now.
This isn't available when viewing archived charts.
-
To view data over:
-
An hour, select Hour.
-
A day, or 24 hours, select Day.
-
A week, select Week.
-
A month, select Month.
-
-
To change the length of time you are viewing:
-
To zoom in, or to view a shorter time, select .
-
To zoom out, or to view a longer time, select .
-
To zoom in or out, mouseover the widget, hold Ctrl, and scroll with your mousewheel.
-
-
To zoom in on a specific time period:
-
Select and drag on a widget to select a specific time period.
-
Press Enter.
-
-
To reset the chart back to the default level of zoom, select Reset.
Viewing data over a specific time period
To view data over a specific time period:
-
Mouseover a widget to highlight a specific time period.
-
Or, select and drag on a widget to select a specific time period.
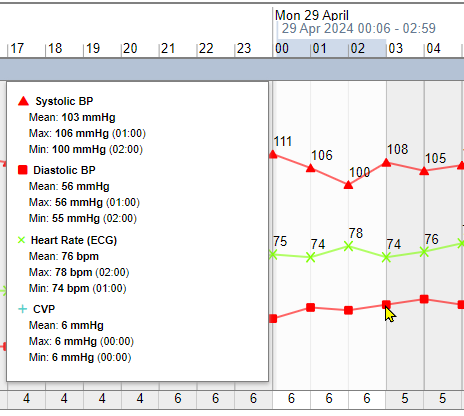
A box appears that contains data from the time period. Depending on the series in the widget, the box might show:
-
Aggregated data, for example, the average or sum
-
Summary text from a case notes entry, and a link to the entry
-
Details of a prescription
In the example below, the widget shows four series: the patient's blood pressure, heart rate, and central venous pressure (CVP). The time between 00:06 and 02:59 is highlighted. The box shows the average, maximum, and minimum values during those three hours.
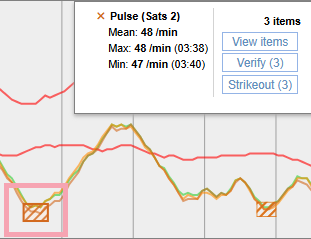
Viewing a list of data from MDI devices
You can view a list of data Nervecentre received from an MDI device. This list includes excluded data.
Your organisation might exclude data that is definitely inaccurate. For example, if a probe becomes dislodged or disconnected, a device might send a value of 0. Nervecentre still receives excluded data, but it doesn't show the data in charts to avoid distorting graphs. You can view excluded data if you want to understand why there is a gap in a chart.
-
To view all data in a series over a specific time period:
-
Select and drag on a widget to select a specific time period.
-
Select next to the name of the series, then select View items.
-
-
To view data that needs verifying:
-
Select an area of the chart with a shaded background.
-
Select View items
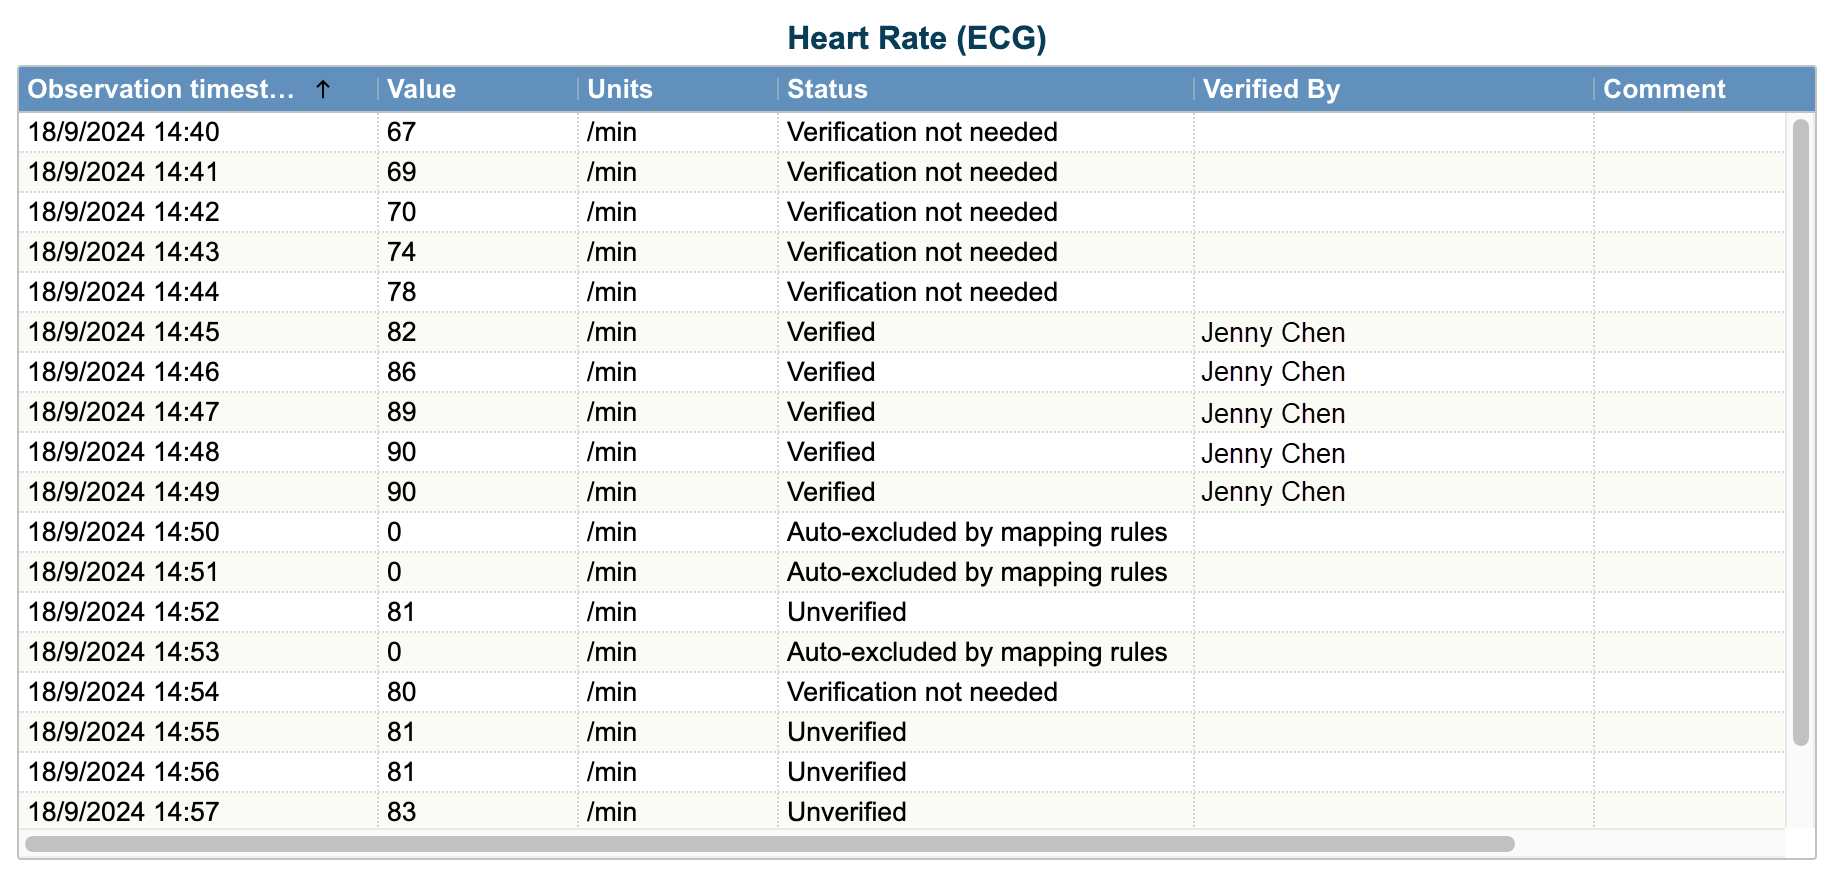
-
A list of data appears. Data that was automatically excluded has the status Auto-excluded by mapping rules.
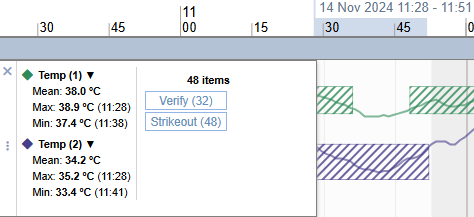
Verifying data from MDI devices
You might need to verify data that is outside of a specified range. For example, vital signs outside normal resting ranges. Data that needs verifying appears on a shaded background.
-
Choose the data you want to verify.
-
To choose data from one or more series, select and drag on a widget to select a specific time period.
-
To choose data from one series, select an area of the chart with a shaded background.
The number of data items to verify displays next to Verify.
-
-
Verify your chosen data.
-
To verify all the data selected, select Verify.
-
To verify the data of a specific series, select > Verify.
You can't remove a mark of verification from the data.
-
Striking out data from MDI devices
You might want to strike out specific data that Nervecentre received from an MDI device. For example, if a patient was moving around in their bed, the ECG might measure an incorrect heart rate.
-
Choose the data you want to strike out.
-
To choose data from one or more series, select and drag on a widget to select a specific time period.
-
To choose data from one series, select an area of the chart with a shaded background.
The number of data items selected displays next to Strikeout.
-
-
Strike out the data you selected.
-
To strike out all the data selected, select Strikeout.
-
To strike out the data of a specific series, select > Strikeout.
You can't undo this action.
-
Locking a template chart or pinned chart
You can lock a template chart or pinned chart so the current time is always visible.
-
Open the patient's record.
-
From Inpatients, select Patient List > double-click on a patient's name > Patient Detail.
-
From Outpatients, select Clinic List > double-click on a patient's name > Patient Detail.
-
-
Select Charts.
A list of charts appears.
If the patient has a pinned chart, the most recently pinned chart appears. To view the list of charts, select < More charts.
-
From the list, select a chart.
The chart must not be archived.
-
Select .
The chart now shows the current time. When time advances, the chart moves so the current time always displays.
If you select and drag to look at a different time, the chart unlocks.
Marking a template chart as a favourite
If you have a template chart that you like to use, you can mark that chart as a favourite. Only you can see your favourites. You can use your favourite charts for any patient.
-
Open the patient's record.
-
From Inpatients, select Patient List > double-click on a patient's name > Patient Detail.
-
From Outpatients, select Clinic List > double-click on a patient's name > Patient Detail.
-
-
Select Charts.
A list of charts appears.
If the patient has a pinned chart, the most recently pinned chart appears. To view the list of charts, select < More charts.
-
From the list, select a chart.
The chart must not be pinned or archived.
-
Select .
Pinning a template chart for a patient
When you pin a template chart, you make a copy of the chart that is specific to that patient. Pinned charts show data from a specific start time to the current time. When you view a patient's charts, their most recently pinned chart appears first.
For example, if a patient visits ICU, you might pin a chart at the start of their visit. You can then monitor their progress over their visit.
-
Open the patient's record.
-
From Inpatients, select Patient List > double-click on a patient's name > Patient Detail.
-
From Outpatients, select Clinic List > double-click on a patient's name > Patient Detail.
-
-
Select Charts.
A list of charts appears.
If the patient has a pinned chart, the most recently pinned chart appears. To view the list of charts, select < More charts.
-
From the list, select a chart.
The chart must not be pinned or archived.
-
Select .
The start time for the chart is 24 hours before you pinned the chart.
Pinned charts always show data up to the current time.
-
To change the start date:
-
From DATA RANGE, select .
-
Select a date the chart starts.
-
Enter a time the chart starts.
-
To save your changes, select .
-
Archiving a pinned chart
When you archive a pinned chart, you add an end time to the pinned chart. Archived charts show data from a specific start time to a specific end time. You can view a patient's archived charts.
For example, if a patient visits ICU, you might pin a chart at the start of their visit, and archive the chart at the end of their visit. You can view the archived chart after their visit.
-
Open the patient's record.
-
From Inpatients, select Patient List > double-click on a patient's name > Patient Detail.
-
From Outpatients, select Clinic List > double-click on a patient's name > Patient Detail.
-
-
Select Charts.
A list of charts appears.
If the patient has a pinned chart, the most recently pinned chart appears. To view the list of charts, select < More charts.
-
From the list, select a pinned chart.
-
Select Archive.
A warning message appears. The warning explains the chart is saved against the patient, and no further data is loaded beyond the archive date.
-
Select Archive.
The end time is the time you archived the chart.
-
To change the start date and end date:
-
From DATA RANGE, select .
The start date is on the left, and the end date on the right.
-
Select a date the chart starts.
-
Enter a time the chart starts.
-
Select a date the chart ends.
-
Enter a time the chart ends.
-
To save your changes, select .
-
Deleting a pinned or archived chart
-
Open the patient's record.
-
From Inpatients, select Patient List > double-click on a patient's name > Patient Detail.
-
From Outpatients, select Clinic List > double-click on a patient's name > Patient Detail.
-
-
Select Charts.
A list of charts appears.
If the patient has a pinned chart, the most recently pinned chart appears. To view the list of charts, select < More charts.
-
From the list, select a pinned chart, or archived chart.
-
Select Delete.
A warning message appears. The warning explains the chart is removed from the patient's record. Any changes you made to the chart for this patient are lost.
-
Select Delete.
Did you find this article helpful? Yes No
Sorry about that. Our help is a work in progress and we welcome any feedback.
Why wasn't this helpful? Please select one reason:
Great!
Thanks for taking the time to give us some feedback.