Nervecentre V9.0 Help for Users
About charts
Nervecentre Charting allows you to view changes in a patient's data over time. Charts bring together different elements of patient care into a single view, so that you can understand the effect of your interventions. For example, you can view how your care has affected a patient's temperature, blood pressure, and other recorded observations over the past few days.
There are three types of chart:
-
Template charts
You can use template charts for any patient. You can view the last 6 months of a patient's data up to the current time.
-
Pinned charts
You can pin a template chart to create a pinned chart for a patient. A pinned chart shows a patient's data from a specific start time to the current time.
-
Archived charts
You can archive a patient's pinned chart. An archived chart shows a patient's data from a specific start time to a specific end time.
About charts on a mobile
You can't do this on a mobile.
About charts on a desktop
 What is a chart?
A chart is a group of widgets arranged in a specific order. A widget is a group of series. A series contains data from one or more data fields.
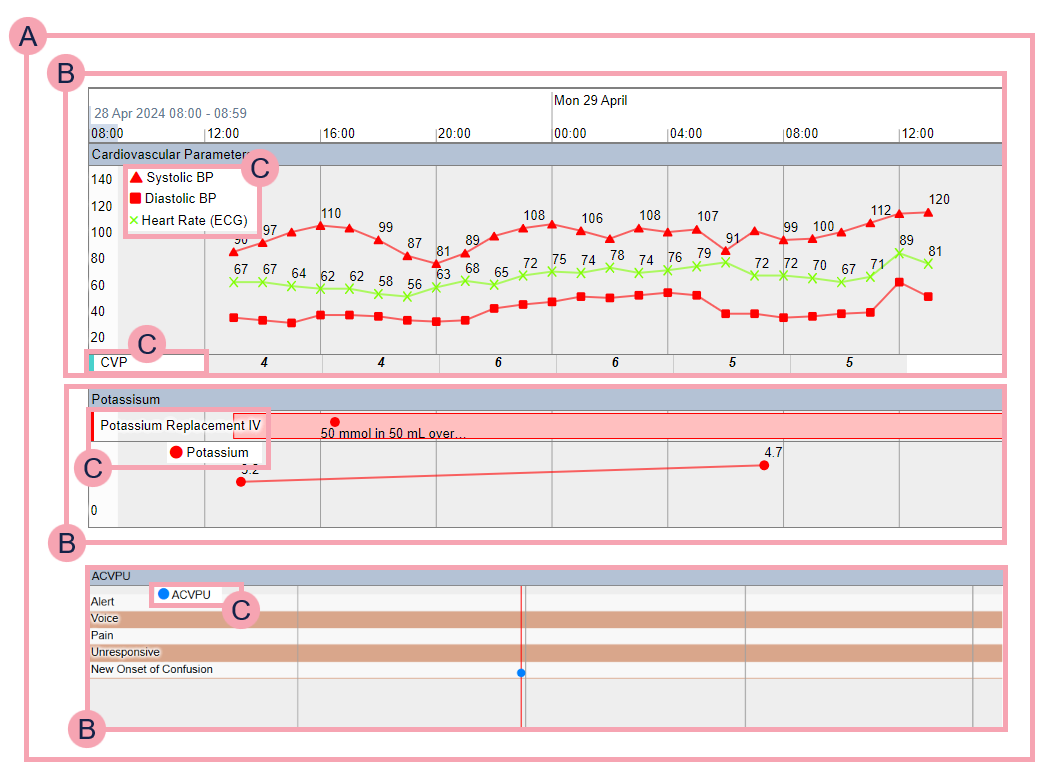
Below is a diagram of a chart.

Show me an example
The chart below shows how the patient's blood pressure, heart rate, central venous pressure, potassium levels, and response changed over time. It also shows the patient's IV of replacement potassium.
|
|
A chart is made of one or more widgets. This chart has three widgets. |
|
|
A widget is made of one or more series. In this example:
|
|
|
Each series in a widget displays data from one or more data fields. You can display data in a series in:
|


 About data fields
A data field is an item in the Nervecentre database. For example ‘Heart Rate’, or ‘Haemoglobin’.
The Nervecentre database might contain data fields with similar names, but the data for each field comes from different sources. Each data field has a unique identifying code. For example, you might have two data fields for haemoglobin: one data field for haemoglobin results from lab tests, and another data field for haemoglobin results from blood gas analysers.
About series
A series contains data from one or more data fields. A series can only contain one type of data field, for example, only observations, or only medications.
All series are shared between all users. Any changes to a series affects all charts that use the series.
About widgets
A widget is a group of series. Series in a widget display in a specific order, and they can display differently to each other. For example, one series might display data as a line graph, and another series might display data in a table.
Widgets can be shared between charts. If a widget is not shared, it can only be used on that chart.
About template charts
A template chart is a chart that is not patient-specific.
About pinned charts
A pinned chart is a patient-specific chart that has a start date.
About archived charts
An archived chart is a patient-specific chart that has a start date and end date.
Did you find this article helpful? Yes No
Sorry about that. Our help is a work in progress and we welcome any feedback.
Why wasn't this helpful? Please select one reason:
Great!
Thanks for taking the time to give us some feedback.