Nervecentre V9.0 Help for Users
Overview of Live Flow
From Live Flow, you can view live flows and flow metrics. A live flow is an organised diagram containing flow metrics. A flow metric is a query that returns a number or list of an item, for example, a list of patients or a number of bed spaces.
 Overview of Live Flow
You can view live flows and flow metrics from Live Flow. By default, Live Patient Flow is shown.

|
Home |
Your home dashboard. You can customise your home dashboard to show your choice of information. Your home dashboard is available across Nervecentre. |
|
Live Patient Flow |
View graphic displays of patient data, updated in real time. These are live flows. Live flows contain flow metrics. A flow metric is a query that returns a number or list of an item, for example, a list of patients or a number of bed spaces. |
|
Patient List |
View patient list dashboards. For some flow metrics, when you select the flow metric in a live flow, Patient List shows a list of patients returned by the flow metric. |
|
Patient Detail |
View and edit demographic and clinical information about a patient. You can search for a patient to view their details, or from Patient List you can double-click on a patient's name to view their details. |
|
Waiting times |
View flow metrics about waiting times. |
Live Patient Flow
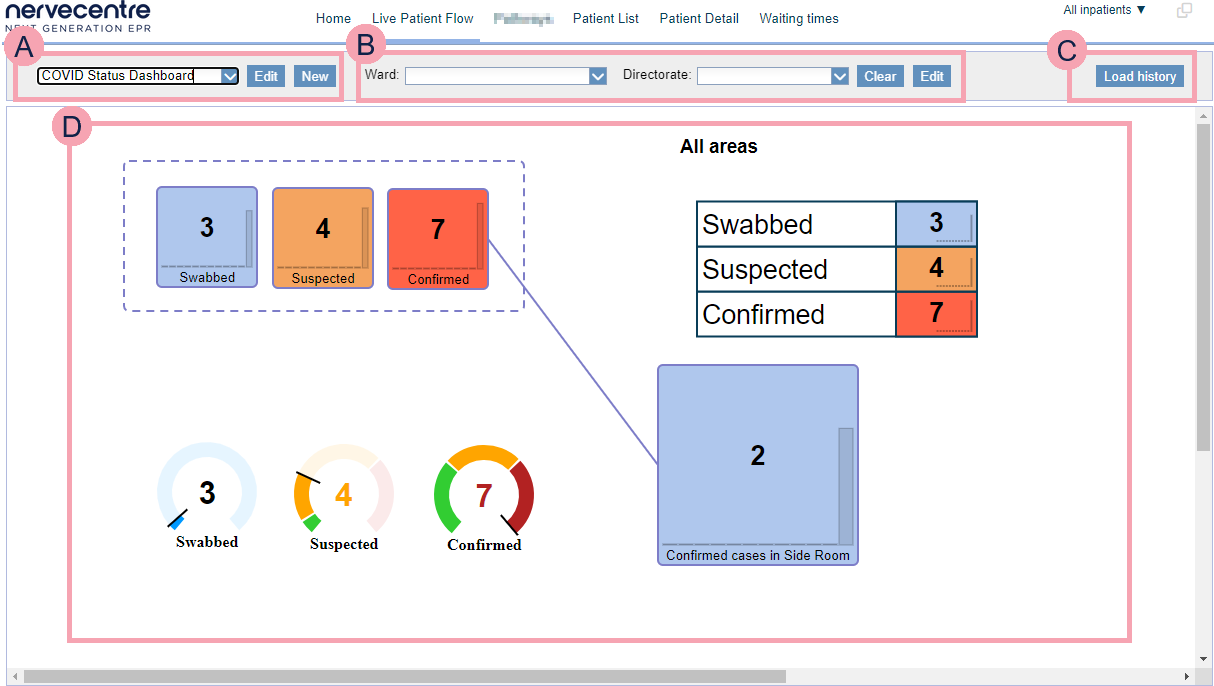
You can view flow metrics in an organised diagram called a live flow from Live Flow > Live Patient Flow.
|
|
Select a live flow from the list. If you have the correct permissions, you can create and edit live flows.
|
|
|
You can filter the live flow to just show information for a specific area:
|
|
|
You can view history the of the selected live flow or an individual flow metric.
|
|
|
The selected live flow appears here. Each flow metric shows a number. The number might have an amber or red indicator. Your organisation can choose when the flow metric becomes amber or red. For example, the flow metric might turn amber if the number is greater than 5 and red if the number of patients is greater than 15. When a flow metric is in a square box, you can see a bar chart behind the number. The bar chart shows you the number returned by the flow metric at 30 minutes intervals. The bar chart shows the last 5.5 hours of the flow metric's history. Double-click on a number to view a list of patients returned by that flow metric. If the flow metric is an expression, made up of multiple flow metrics, you might be able to view one of the flow metrics in the expression. |


 Patient List
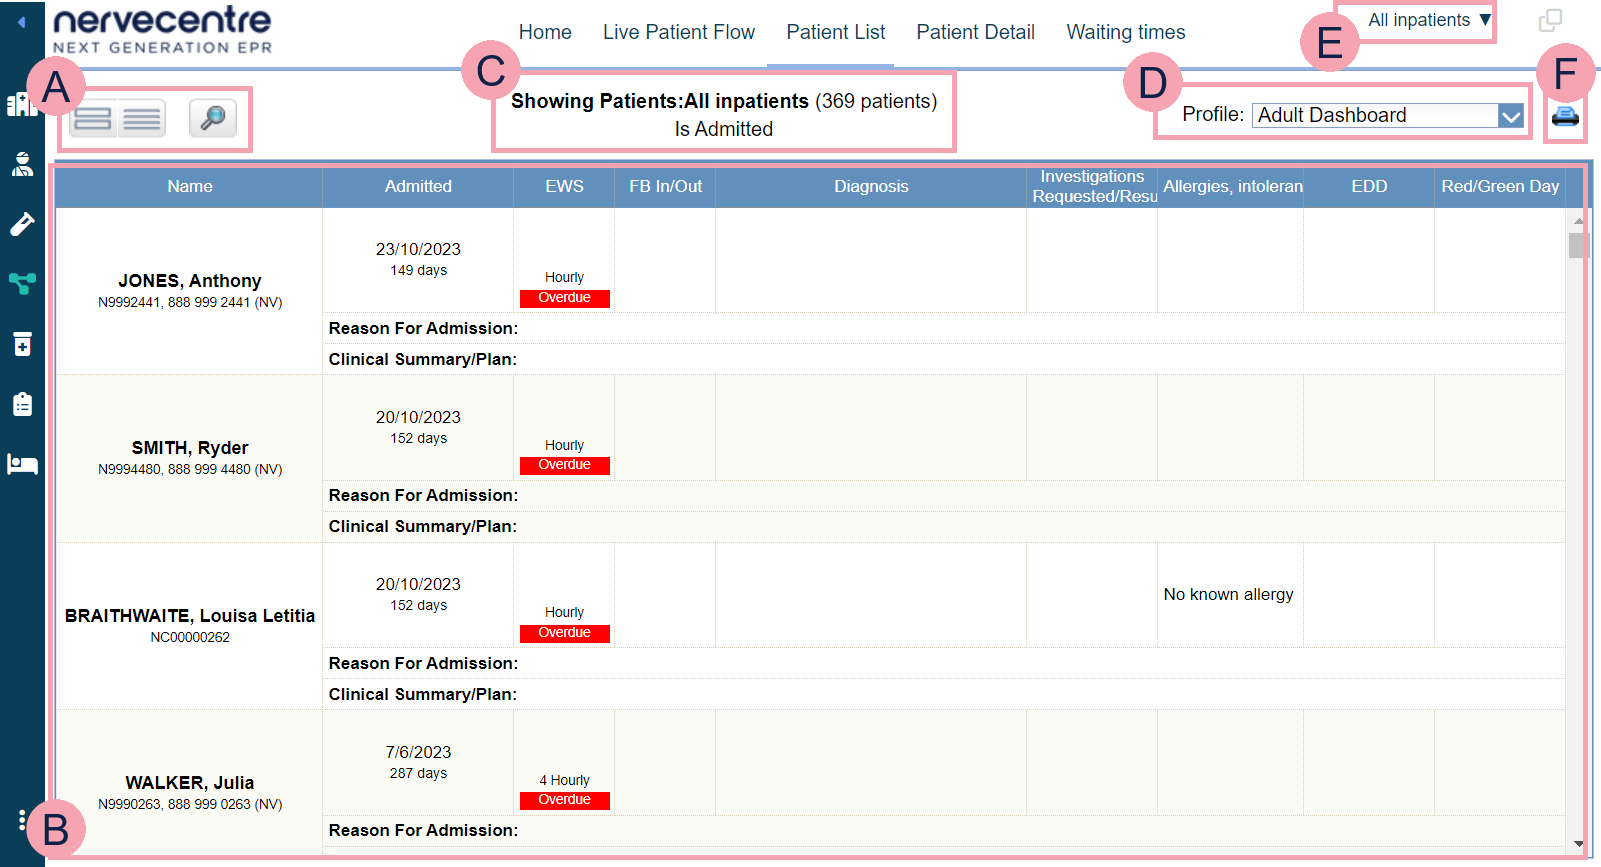
You can view patient lists from Live Flow > Patient List.
For some flow metrics, when you select the flow metric in a live flow, Patient List shows a list of patients returned by the flow metric.
|
|
You can choose what information is shown on a patient list dashboard.
|
|
|
Shows the patient list. You can scroll up and down to view more patients, and scroll left and right to view more information about the patients. Select a column heading to sort the patient list by that heading. Double-click a patient's name to view their patient record. Read more about finding a patient's record You can update some clinical notes from the clinic list. Double-click a column containing a clinical note to update the clinical note. For example, double-click in the column 'Algy' to update the clinical note 'Allergies'. Read more about updating a clinical note Depending on your organisation, you can filter information in patient list dashboards. |
|
|
Shows the name of the patient list and the number of patients in the list. |
|
|
Select a clinical note profile from Profile. The clinical note profile changes the columns and information shown. |
|
|
Select to choose a patient list to view. When you mouseover the name of the current patient list, the name of the previous patient list you viewed shows below. Select the name of the previous patient list to view the list again. |
|
|
Select to print the patient list. |

 Patient Detail
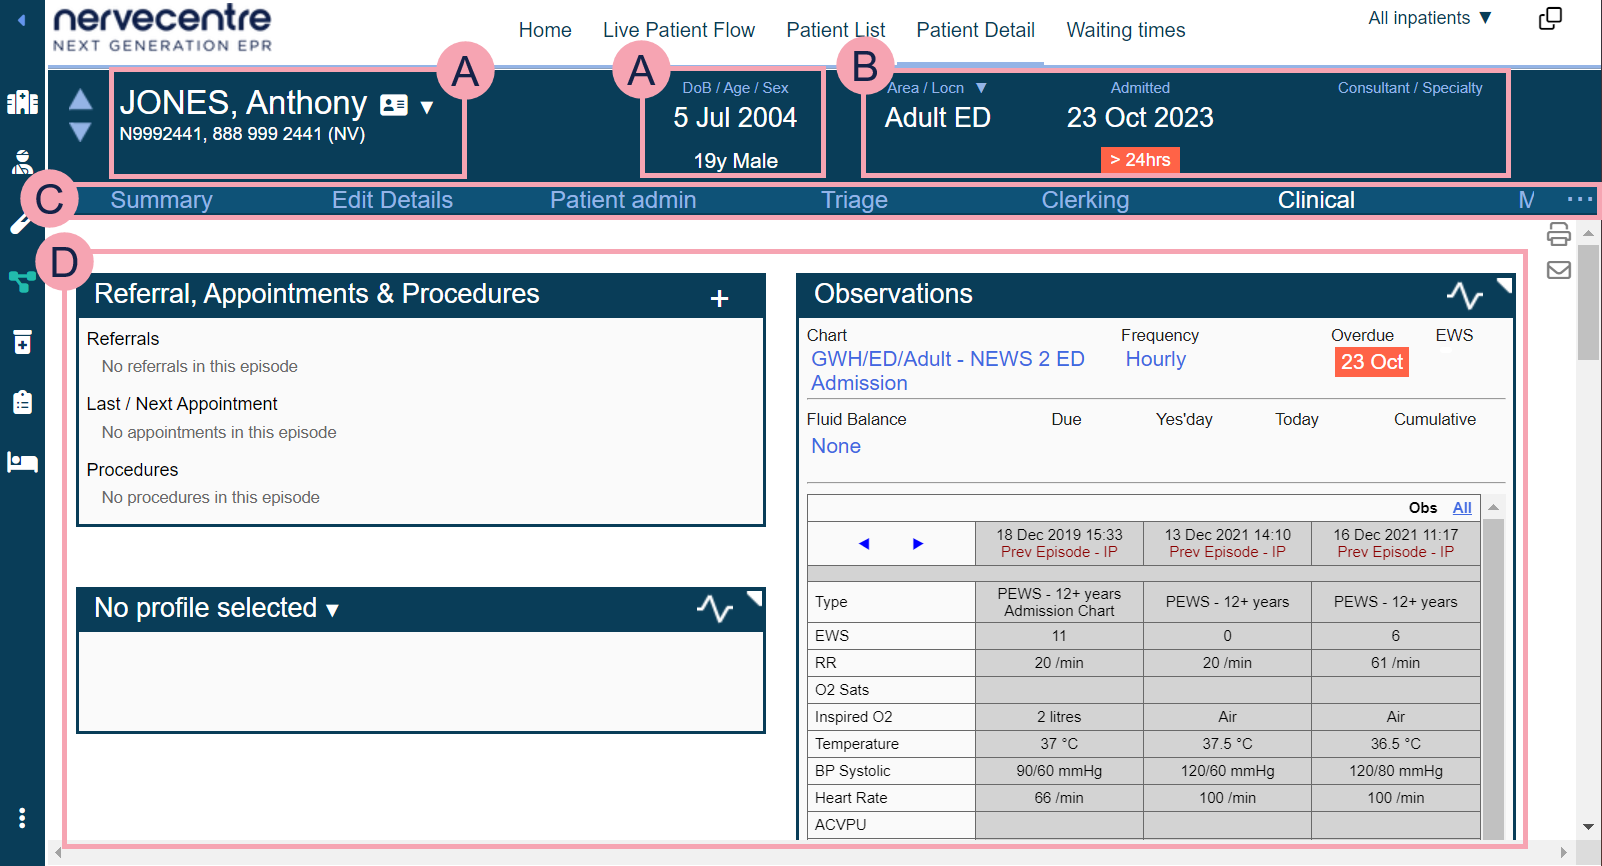
You can view patient details from Live Flow > Patient Detail.
|
|
Move between patients on the same patient list. |
|
|
Shows the patient's name and identifier numbers A number that identifies the patient. For example, a hospital number, NHS number, or local patient identifier.. Select the patient's name to search for another patient. Read more about searching for a patient Shows patient tags and bed tags. For example, your organisation might have patient tags for sepsis, AKI, pregnancy, or disabilities. |
|
|
Mouseover to see the patient's address, and their GP's address. |
|
|
Select to receive notifications about this patient. |
|
DoB / Age / Sex |
Shows the patient's date of birth, age, and sex. |
|
Ward / Bed |
Read more about viewing information about the patient's current visit Select ▼ to transfer the patient. |
|
Admitted |
Admitted shows the date the patient was admitted and the time since admission.
|
|
Consultant / Specialty |
Shows the name of the consultant and the consultant’s specialty. |
|
|
Navigate between the clinical areas of Patient Detail. Select to see more areas. The areas available to you depend your organisation. |
|
|
Shows detailed information about the patient. The information shown depends on the area you select. |
Waiting times
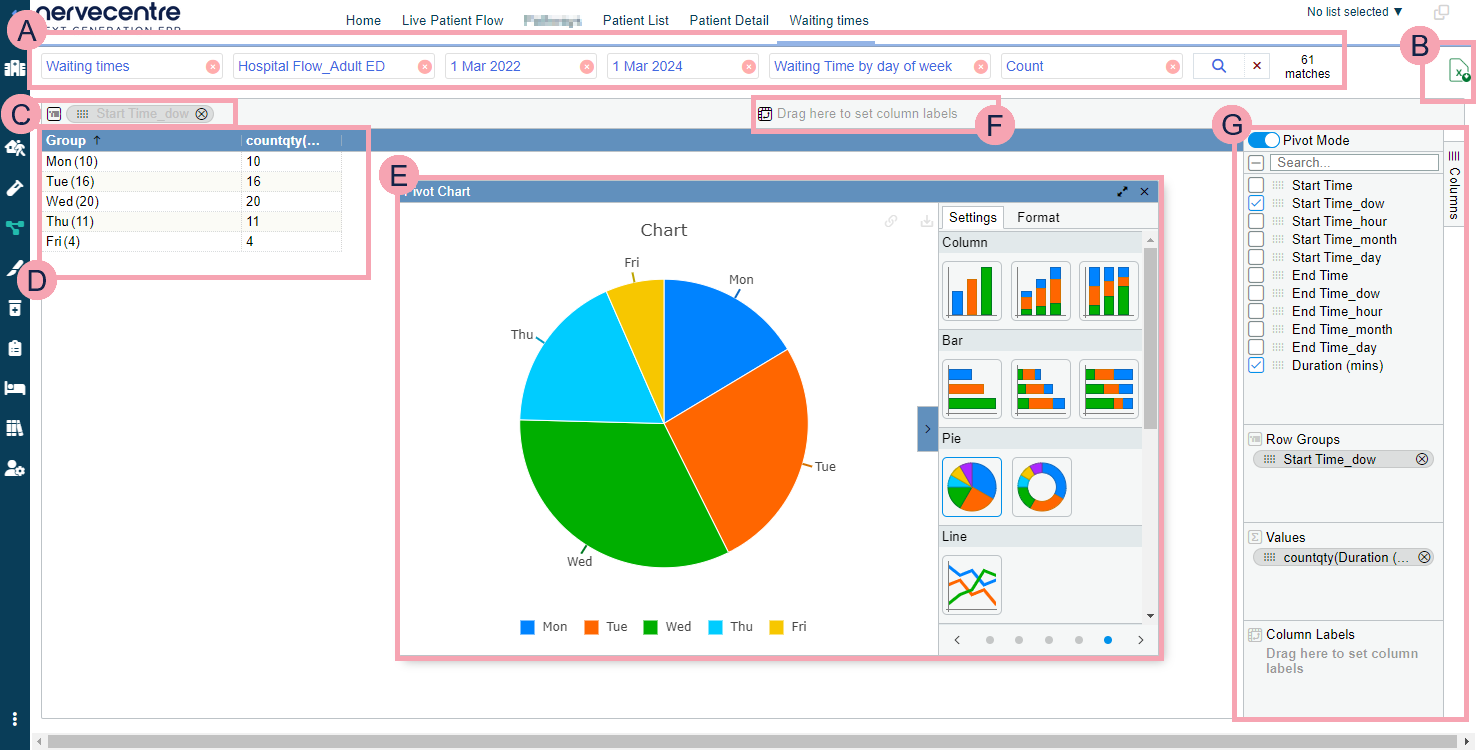
You can view information about waiting times from Live Flow > Waiting Times.
|
|
You can search for specific data about waiting times. Here you can select the criteria for your search. Next to , you can see the number of items returned by your search. To clear one search term, select next to the search term. To clear your whole search, select next to . |
|
|
Select to export the data in the table into an Excel spreadsheet. |
|
|
Drag items here to group rows by that item. The items can be column headings from the table, or items from the list on the right. Select next to the name of a group to remove it. |
|
|
Shows the table of data returned by your search. Select a column heading to sort the data by that heading. Read more about sorting the contents of a column Select next to a row name to expand the group. You can have groups within groups. |
|
|
Shows the pivot chart. Select and drag a corner of the chart to change the size of the window. Select to make the window take up the width of the full screen. Select to close the pivot chart window. |
|
|
Drag items here to set column labels. The items can be column headings from the table, or items from the list on the right. Select next to the name of the column label to remove it. |
|
|
Select to turn on pivot mode and view the pivot chart. Select items in the list to group rows by that item. Clear items in the list to remove groups. You can drag items in the list to other areas. |

Did you find this article helpful? Yes No
Sorry about that. Our help is a work in progress and we welcome any feedback.
Why wasn't this helpful? Please select one reason:
Great!
Thanks for taking the time to give us some feedback.