Nervecentre V9.0 Help for Users
Viewing waiting times
You can view information about waiting times from Live Flow > Waiting Times.
Your organisation creates flow metrics that can be used here. You can choose the flow metrics you view and over what time period.
Viewing waiting times on a mobile
You can't do this on a mobile.
Viewing waiting times on a desktop
 Viewing information about waiting times
-
From Live Flow > Waiting Times > Search, select Waiting times.
-
From Flow metric, select a flow metric in the list.
-
From From, select a start date.
-
From To, select an end date.
-
From Waiting Time Chart, select an option from the list.
-
From Waiting Time Group, select an option from the list.
-
Select .
Overview of Waiting Times
You can view information about waiting times from Live Flow > Waiting Times.
Read more about viewing waiting times
|
|
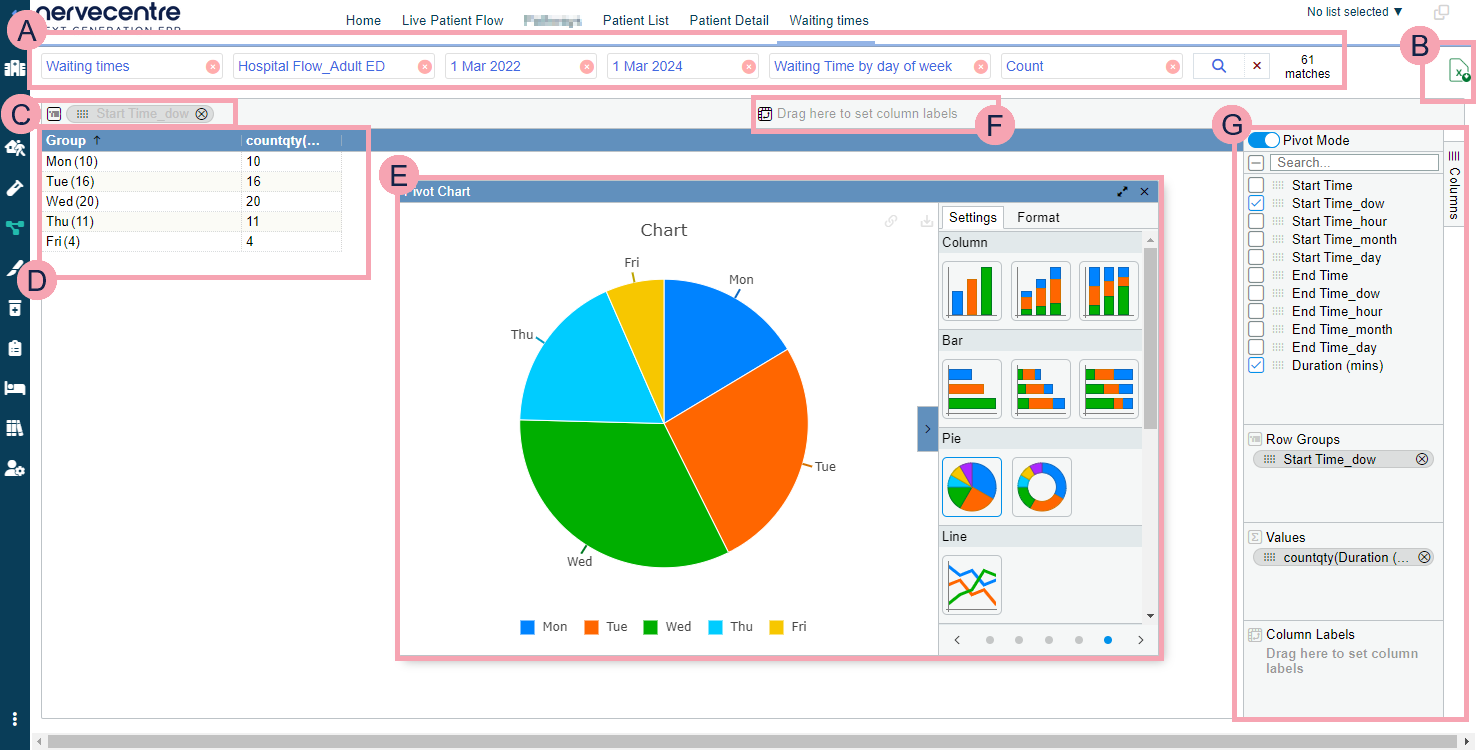
You can search for specific data about waiting times. Read more about viewing waiting times Here you can select the criteria for your search. Next to , you can see the number of items returned by your search. To clear one search term, select next to the search term. To clear your whole search, select next to . |
|
|
Select to export the data in the table into an Excel spreadsheet. |
|
|
Drag items here to group rows by that item. The items can be column headings from the table, or items from the list on the right. Select next to the name of a group to remove it. |
|
|
Shows the table of data returned by your search. Select a column heading to sort the data by that heading. Read more about sorting the contents of a column Select next to a row name to expand the group. You can have groups within groups. |
|
|
Shows the pivot chart. Select and drag a corner of the chart to change the size of the window. Select to make the window take up the width of the full screen. Select to close the pivot chart window. |
|
|
Drag items here to set column labels. The items can be column headings from the table, or items from the list on the right. Select next to the name of the column label to remove it. |
|
|
Select to turn on pivot mode and view the pivot chart. Select items in the list to group rows by that item. Clear items in the list to remove groups. You can drag items in the list to other areas. |


 Overview of the pivot chart
Settings
|
|
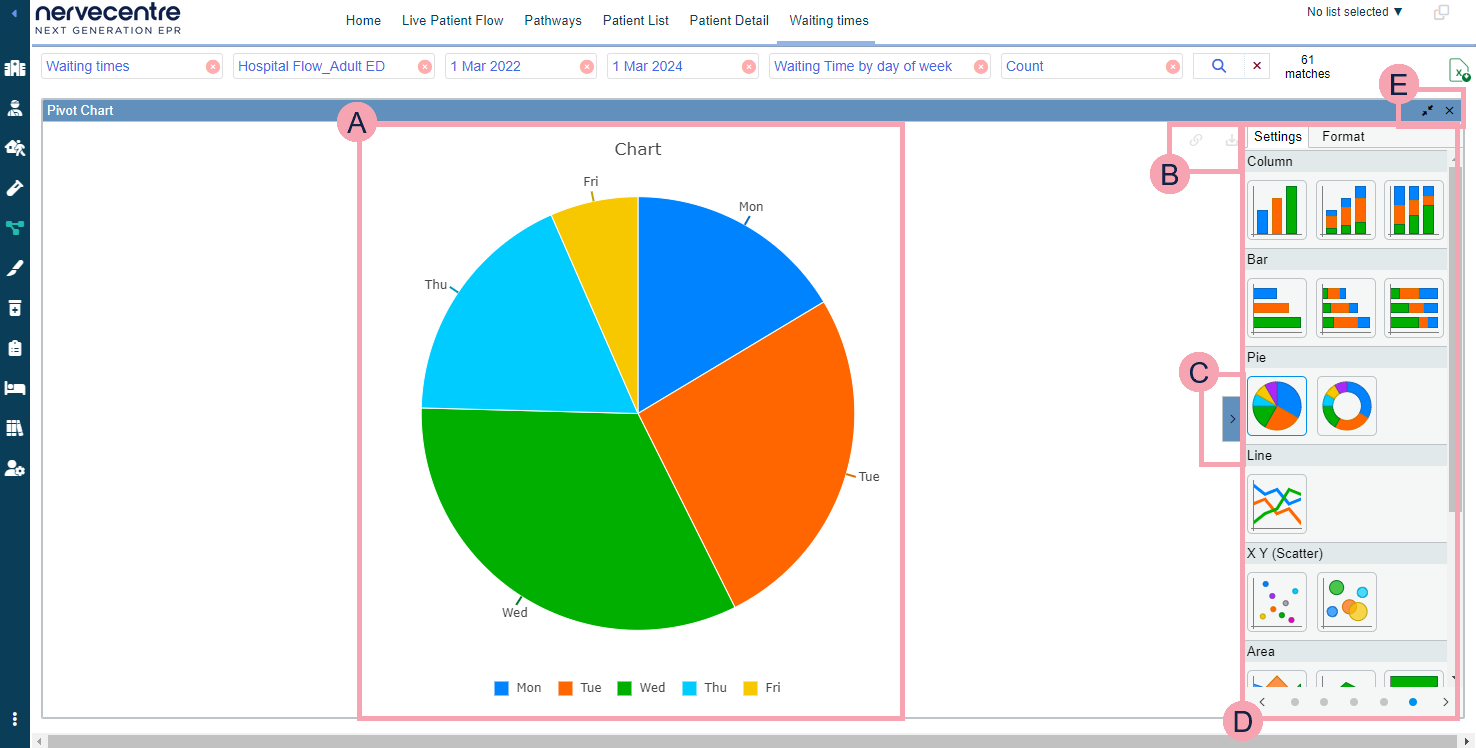
Shows the chart. Mouseover parts of the chart to view more information. |
|
|
Select to link and unlink the chart from the table of data. Select to export the chart as a .png image file. |
|
|
Select to show and hide settings for the chart. |
|
|
From Settings, select the type of chart for your data. You can scroll to view more charts. |
|
|
Select to reduce the size of the chart window. Select to close the chart window. |
Format
|
|
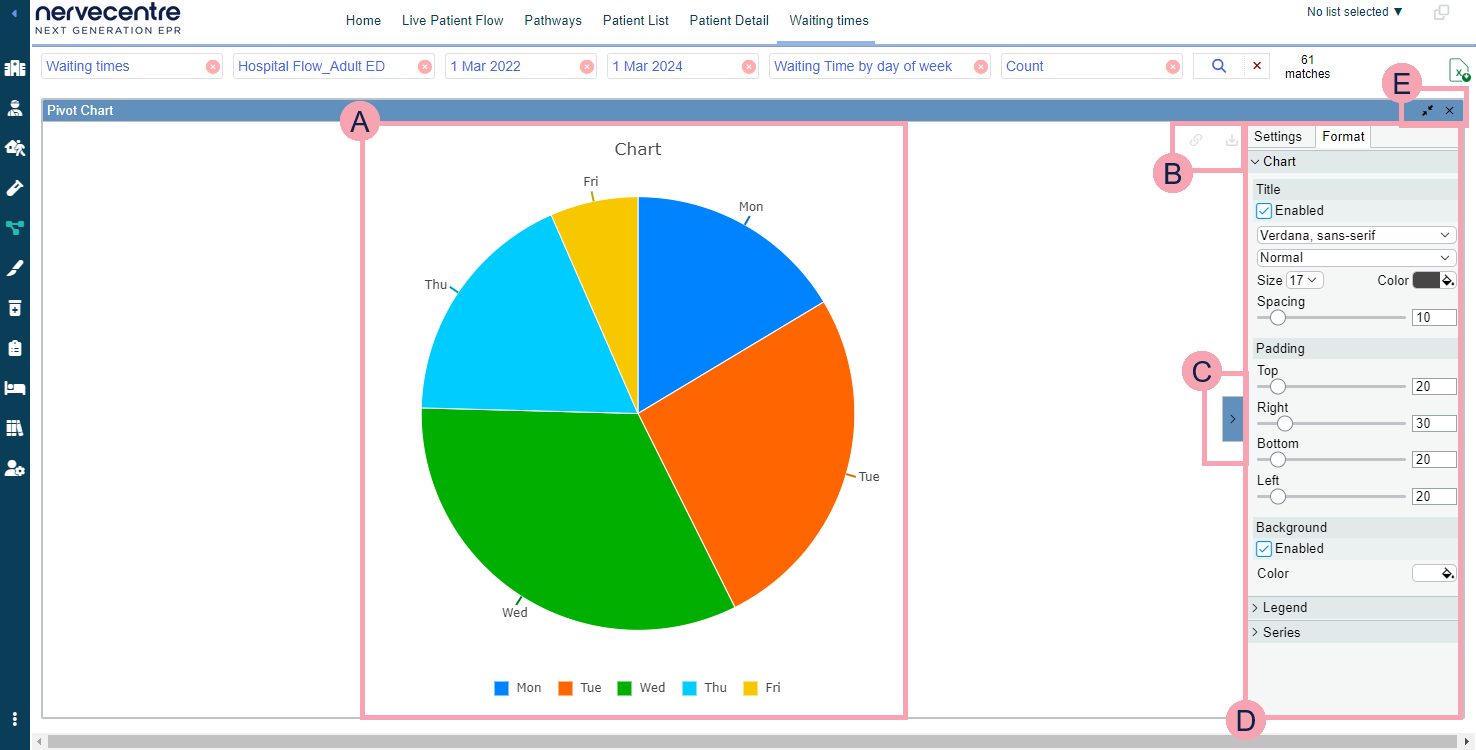
Shows the chart. Mouseover parts of the chart to view more information. |
|
|
Select to link and unlink the chart from the table of data. Select to export the chart as a .png image file. |
|
|
Select to show and hide settings for the chart. |
|
|
From Format, you can:
|
|
|
Select to reduce the size of the chart window. Select to close the chart window. |
Did you find this article helpful? Yes No
Sorry about that. Our help is a work in progress and we welcome any feedback.
Why wasn't this helpful? Please select one reason:
Great!
Thanks for taking the time to give us some feedback.