Nervecentre V9.0 Help for Users
About Live Flow
On a desktop, a live flow is an organised diagram that shows information generated by flow metrics. Flow metrics are queries that return a number or list of an item that fits a criteria. This might be a number of patients, entries, previous visits, or bed spaces.
Nervecentre updates flow metrics every second using the data it has available. Flow metrics help you make better clinical and operational decisions.
Live flows are commonly used to understand the flow of emergency care patients through emergency departments. Live flows are also used to understand the clinical picture for pharmacists across an entire hospital, or multiple hospitals.
About Live Flow on a mobile
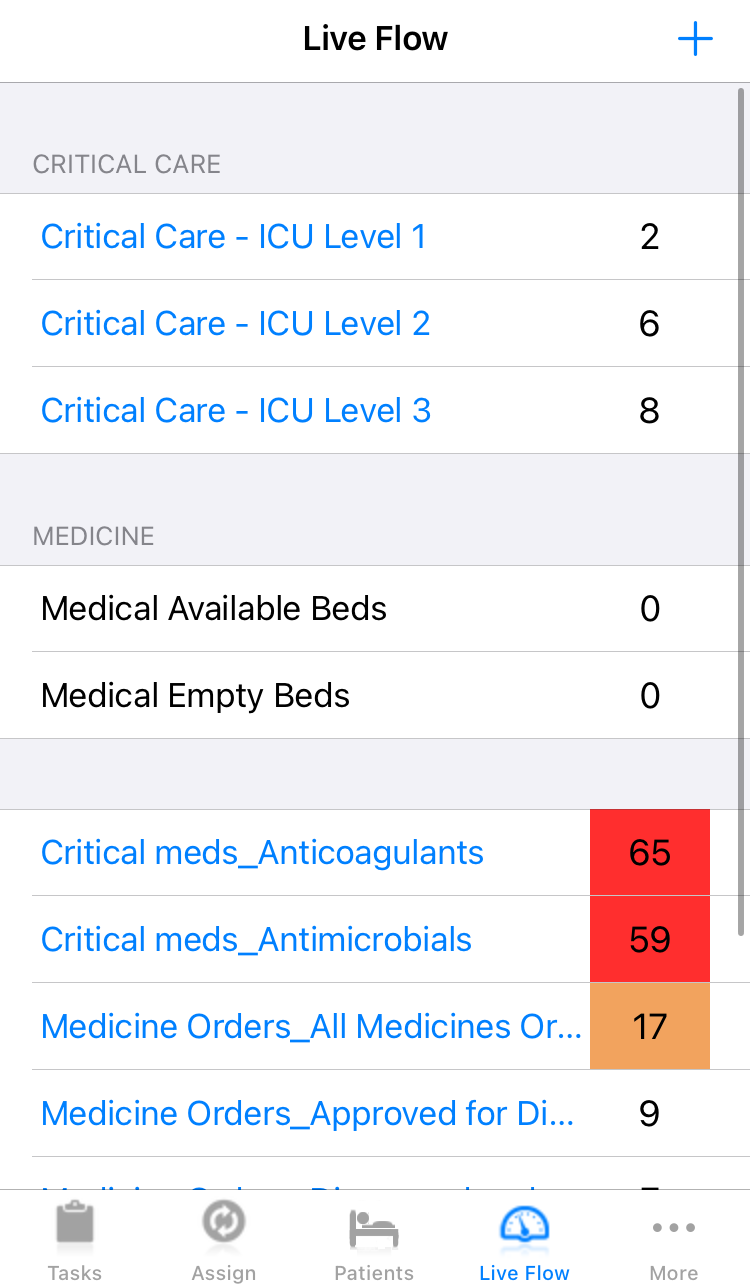
On a mobile, you can view a list of flow metrics from Live Flow. In the image below is a list of flow metrics.
Take a look at the flow metric 'Critical Care - ICU Level 3' and the number next to it. This is the number of current patients in the intensive care unit who are marked level 3. These levels refer to the level of care the patient is receiving in ICU.
Read more about viewing flow metrics on a mobile
About Live Flow on a desktop
On a desktop, you can view flow metrics in an organised diagram called a live flow. You can view live flows from Live Flow > Live Patient Flow.
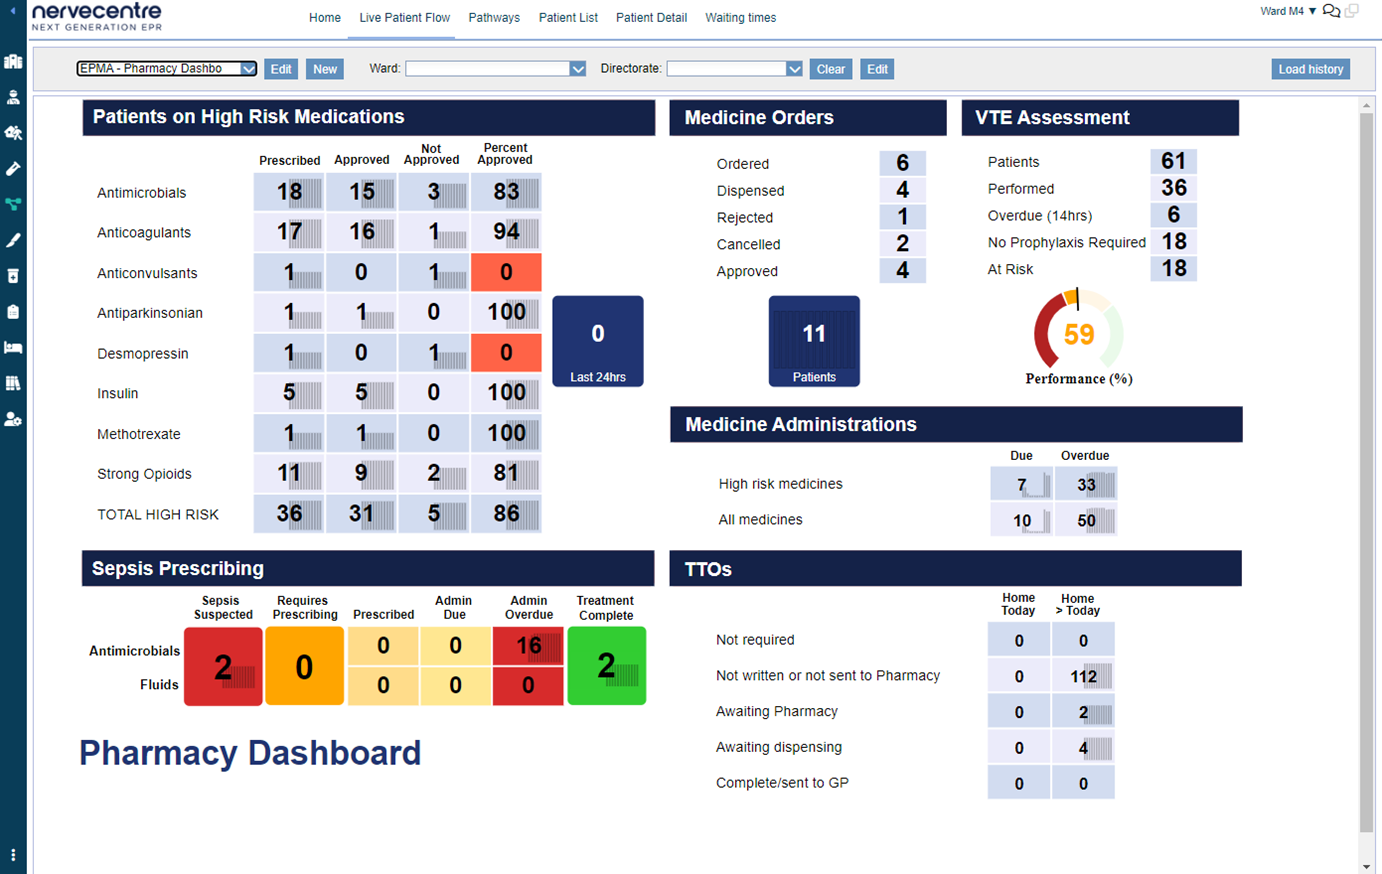
Below is an image of a live flow called 'EPMA - Pharmacy Dashboard'. All the numbers in this dashboard come from flow metrics. Nervecentre updates these metrics every second using the data available.
For example, take a look at the section called 'Medicine Orders'. Underneath 'Medicine Orders' is a list of flow metrics. 'Ordered' shows the number of current inpatients and ED patients who have medication orders.
Read more about viewing flow metrics on a desktop
Did you find this article helpful? Yes No
Sorry about that. Our help is a work in progress and we welcome any feedback.
Why wasn't this helpful? Please select one reason:
Great!
Thanks for taking the time to give us some feedback.