Nervecentre V9.0 Help for Users
Viewing observation charts and graphs
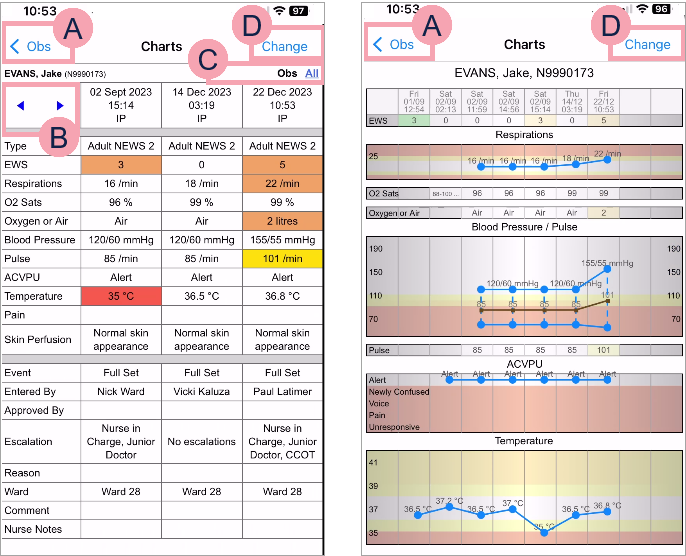
You can view either a chart of observations, or a graph showing trends. The chart is the default option and shows three sets of observations, but you can scroll to view previous observations. The graph shows the last nine sets of observations only.
Viewing the observation chart on a mobile
 Overview of observation charts
|
|
Select to go back to the Obs page. |
|
|
Select to navigate back or forward through submitted observations. |
|
|
Select an option to view specific types of observation. When a patient is on a governed chart, or an additional observation has been recorded, you might see options other than Obs here. Select All to view all observations in one chart. |
|
|
Select Change to change between the table and the graph view. |


 Viewing the chart
-
From your patient list, select a patient, or scan a patient's wristband.
-
From Obs & Assessments, select Obs.
-
Select Chart.
-
Select Obs to go back to Obs.
Viewing the graph
-
From your patient list, select a patient, or scan a patient's wristband.
-
From Obs & Assessments, select Obs.
-
Select Chart.
-
Select Change to view the graph.
-
Select Change to go back to the grid chart.
-
Select Obs to go back to Obs.
The observations you see on the graph depend on your organisation.
Viewing the observation chart on a desktop
Overview of observation charts
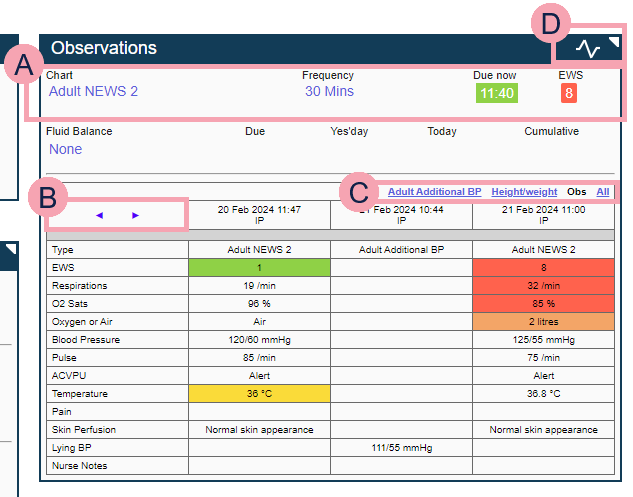
You can view a summary of observations from Inpatients > Patient List > double-click on a patient's name > Patient Detail > Clinical > Observations.
The default view:
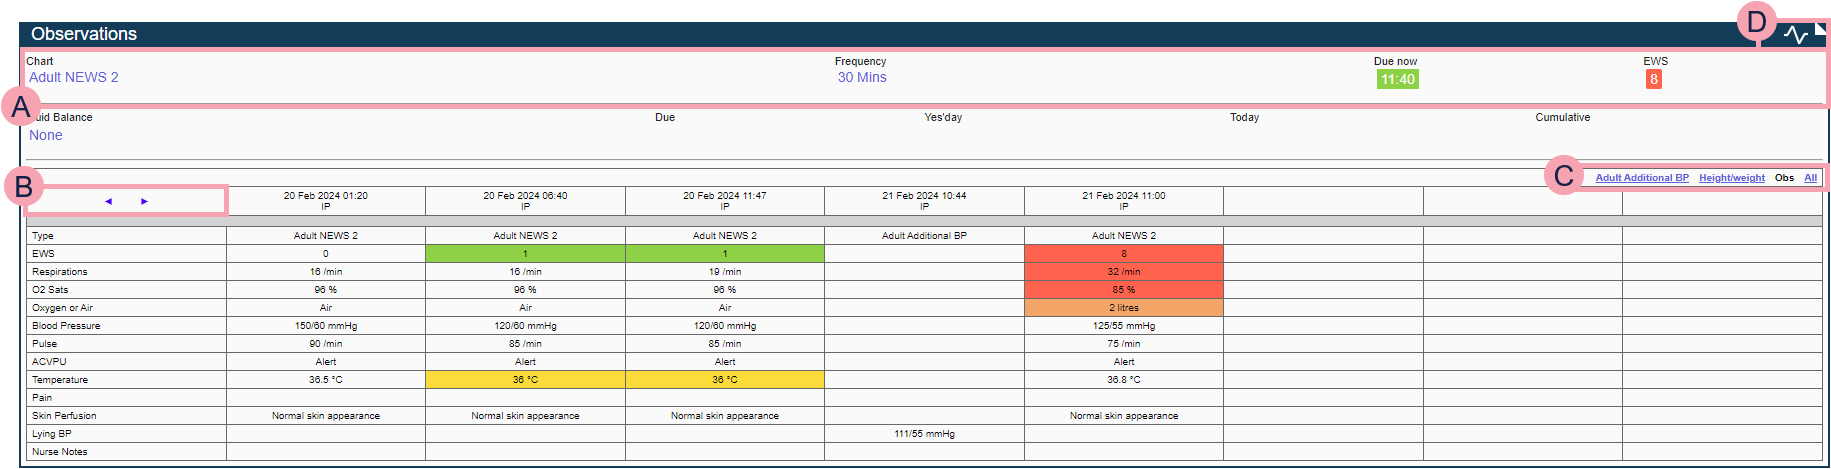
The expanded view:
|
|
Shows details about:
|
|
|
Select to navigate backward or forward through submitted observations. |
|
|
Select to show specific observations, for example mental health, or select All to see all observations entered in one chart. |
|
|
Select Select ◥ to expand the chart across the width of the page. |
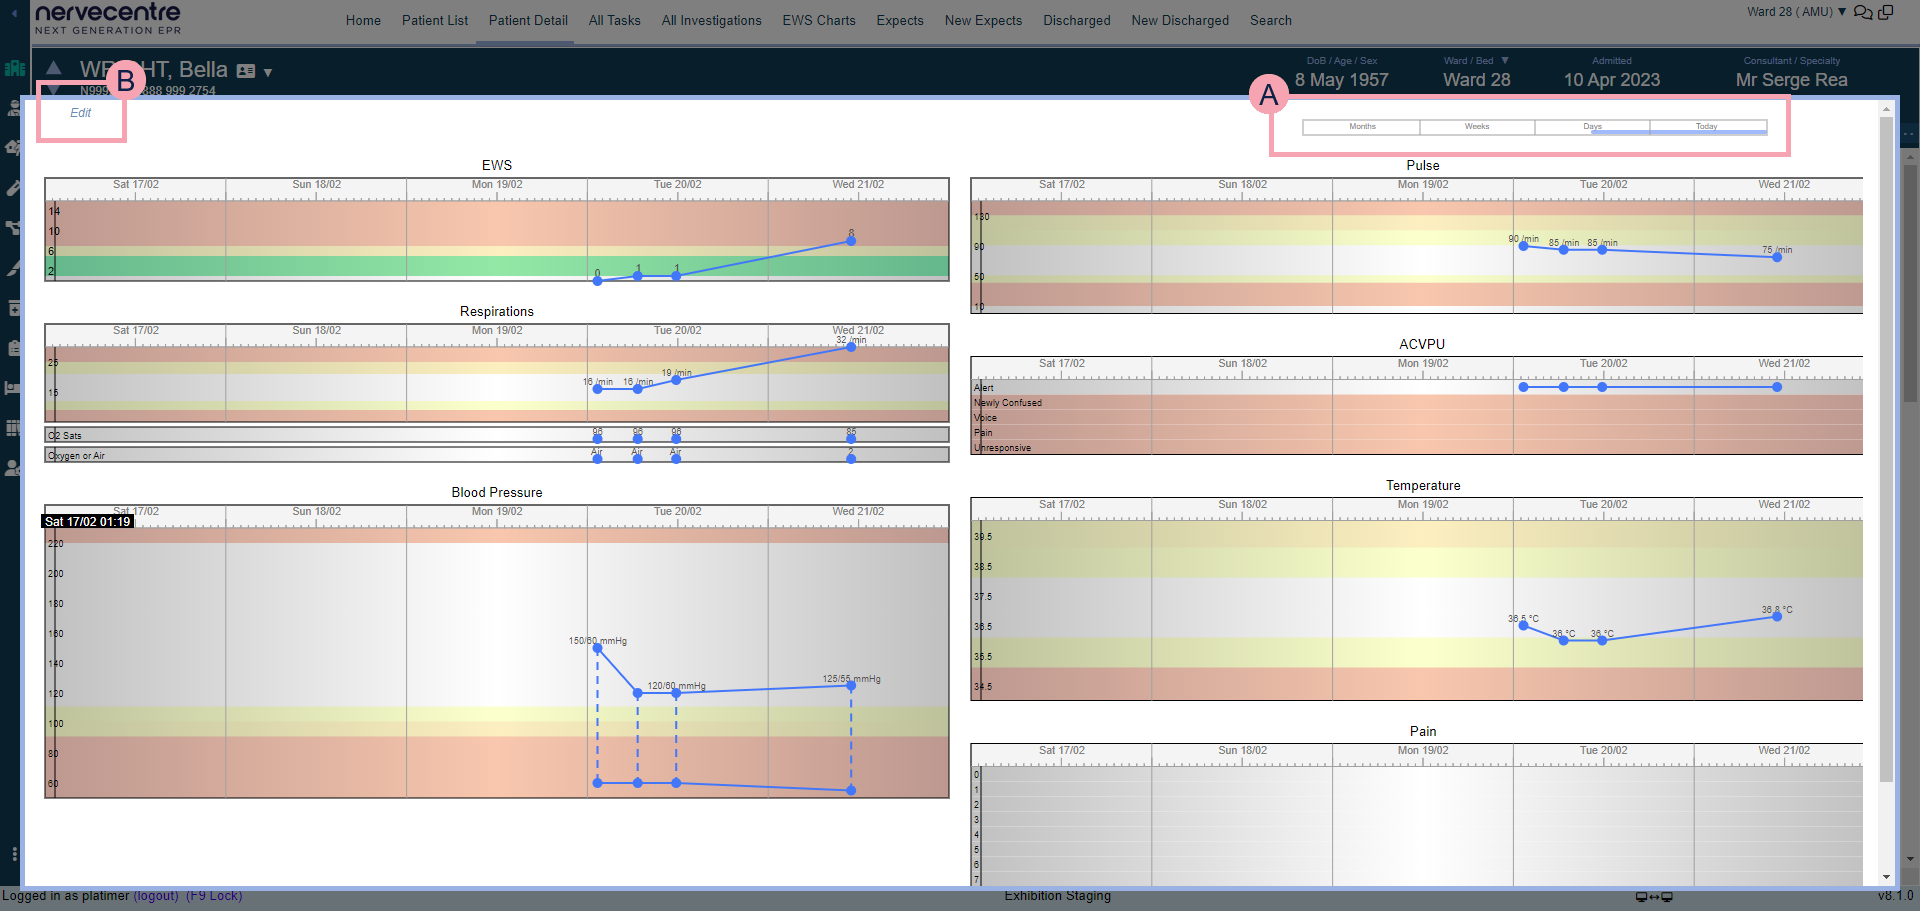
The graph view:
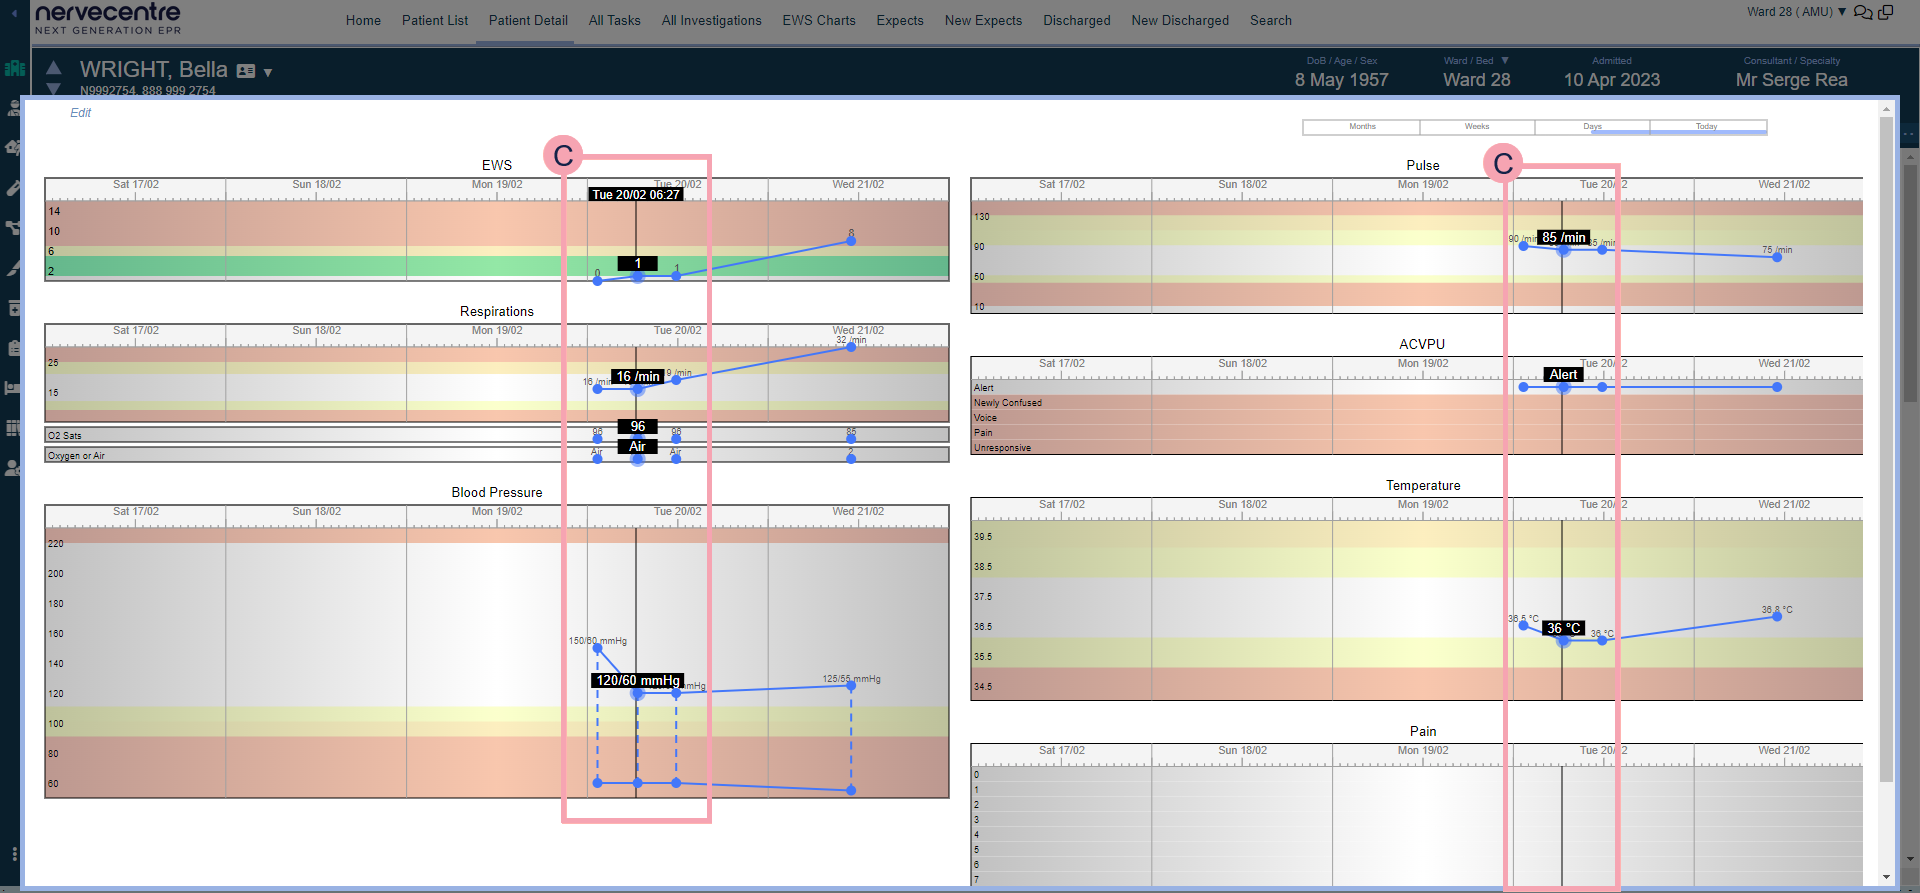
|
|
Select to view graphs over different time periods. Select and hold to drag the time slider. You can view observations recorded today and past observations recorded over months, weeks, and days. |
|
|
Select to choose what to show on the graph. You can select one or more options from Medications, Lab Results, and Obs. |
|
|
Mouseover the observation set you want to see. A black line shows you all the observations for the time selected. |
Viewing the chart
-
From Inpatients > Patient List > double-click on a patient's name > Patient Detail, select Clinical.
-
Find Observations.
The grid is shown by default.
-
To expand the view of the chart to fill to width of the page, select ◥ in the top right corner.
Viewing the graph
-
From Inpatients > Patient List > double-click on a patient's name > Patient Detail, select Clinical.
-
Find Observations.
-
Select
 .
. -
Mouseover the observation set you want to see.
A black line shows you all the observations for the time selected.
Did you find this article helpful? Yes No
Sorry about that. Our help is a work in progress and we welcome any feedback.
Why wasn't this helpful? Please select one reason:
Great!
Thanks for taking the time to give us some feedback.